Daily high attribution, non-overlap sessions
Median session range ratio
Strongest pair: Asia->London
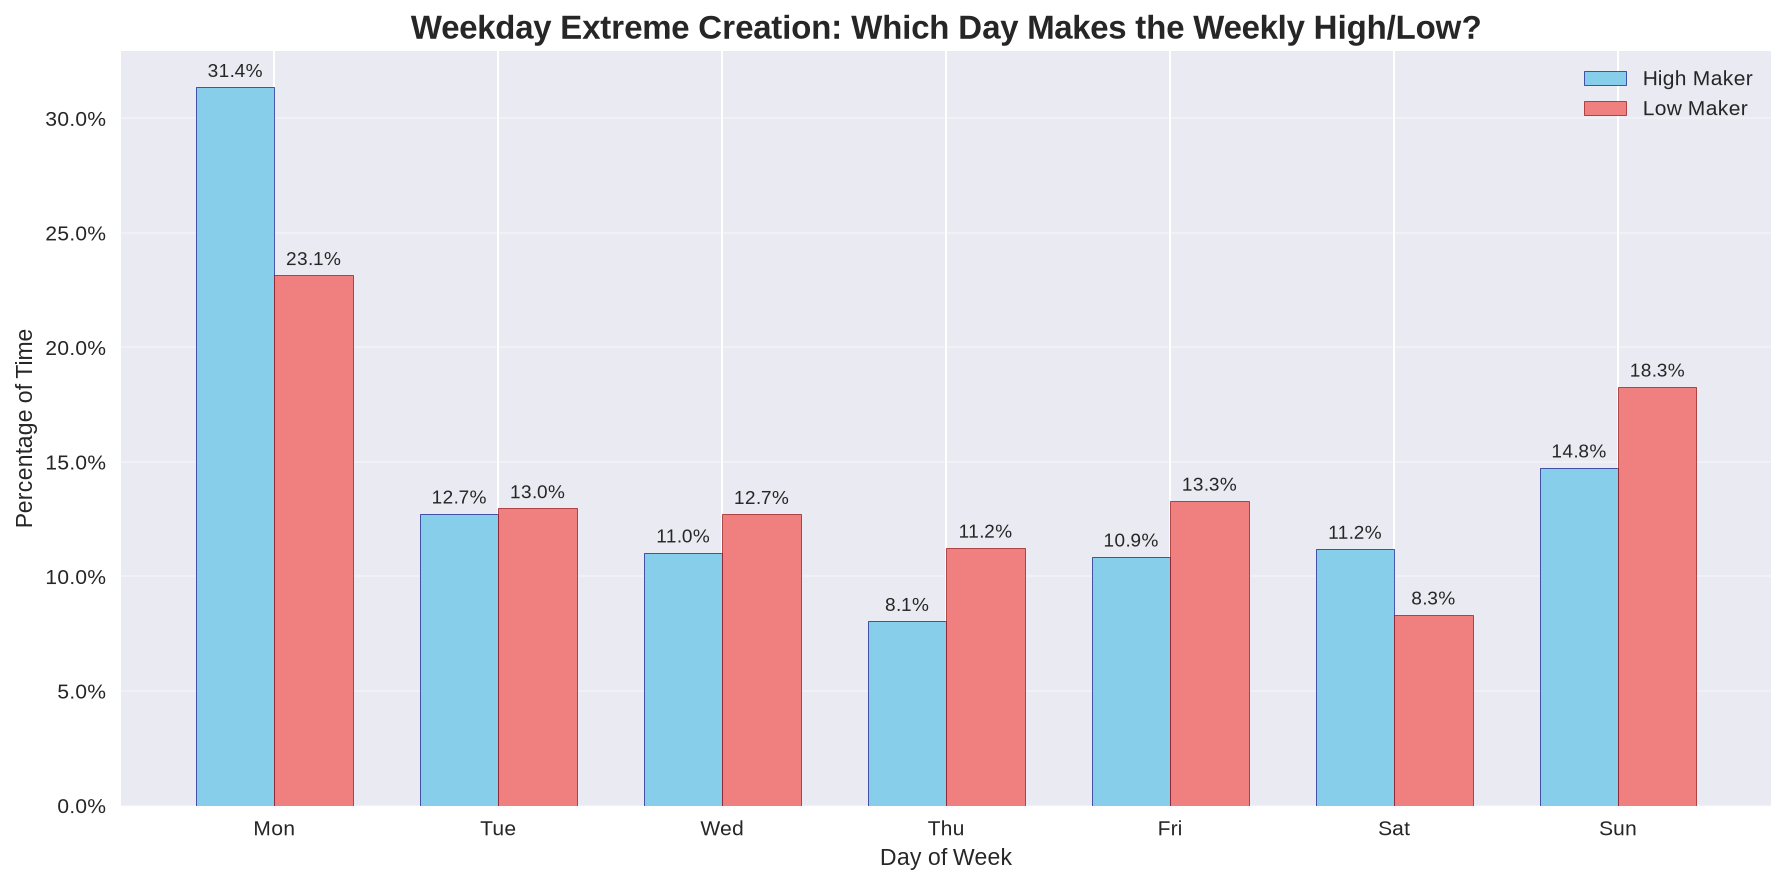
Share of weekly highs printed Monday
Key findings at a glance
1 · Asia sets the day's extremes
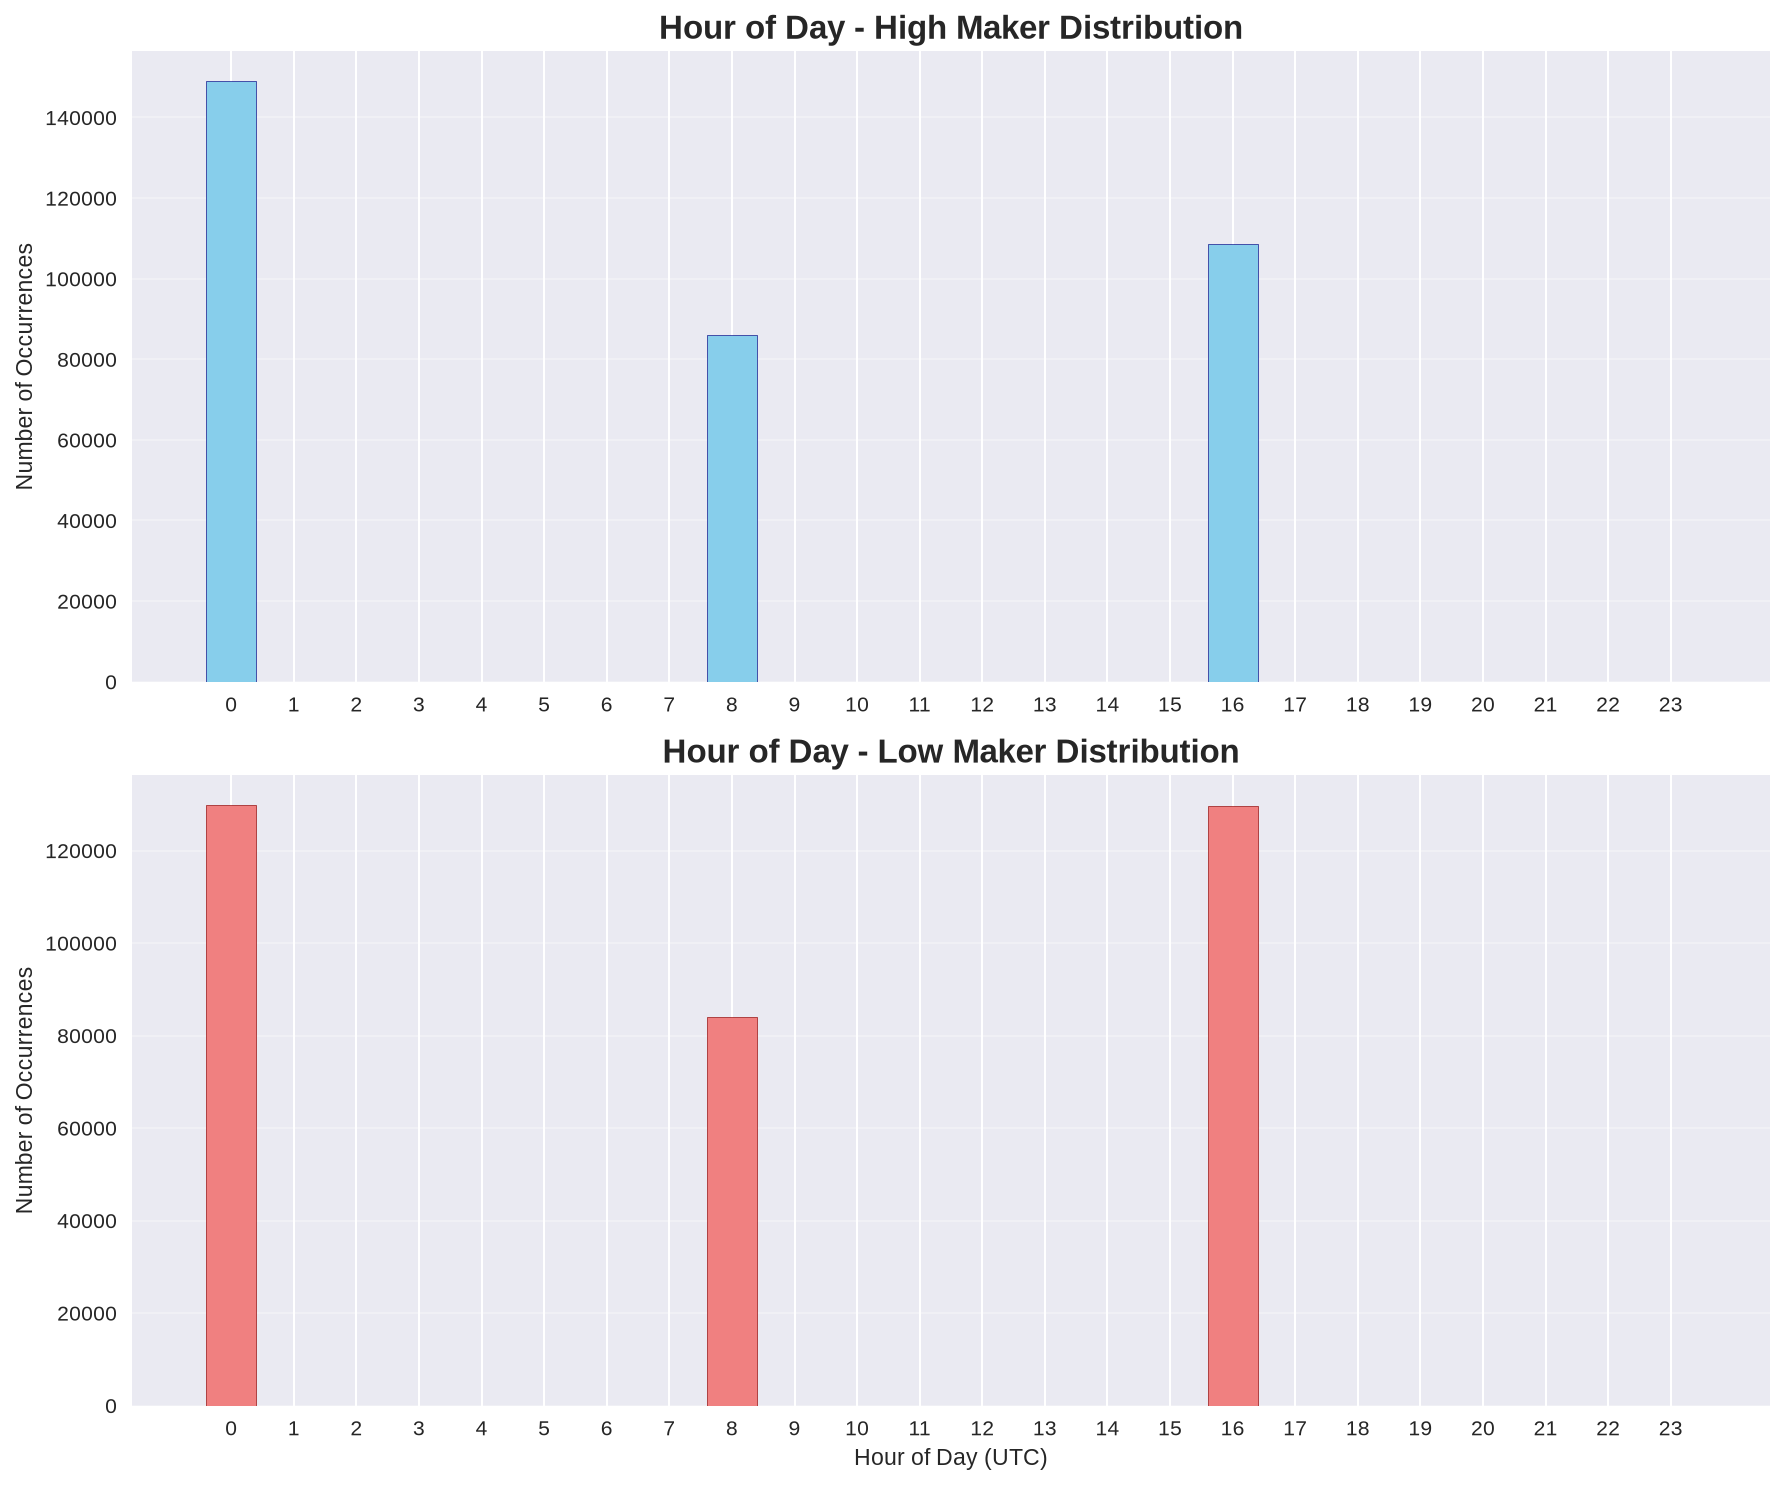
The Asia session creates the daily high 43% of the time and the low 38% - and when any session sets the extreme, it usually happens in that session's first hour.
Watch session opens (00, 08, 16 UTC) for day-range formation.
2 · Prior session levels get swept ~half the time
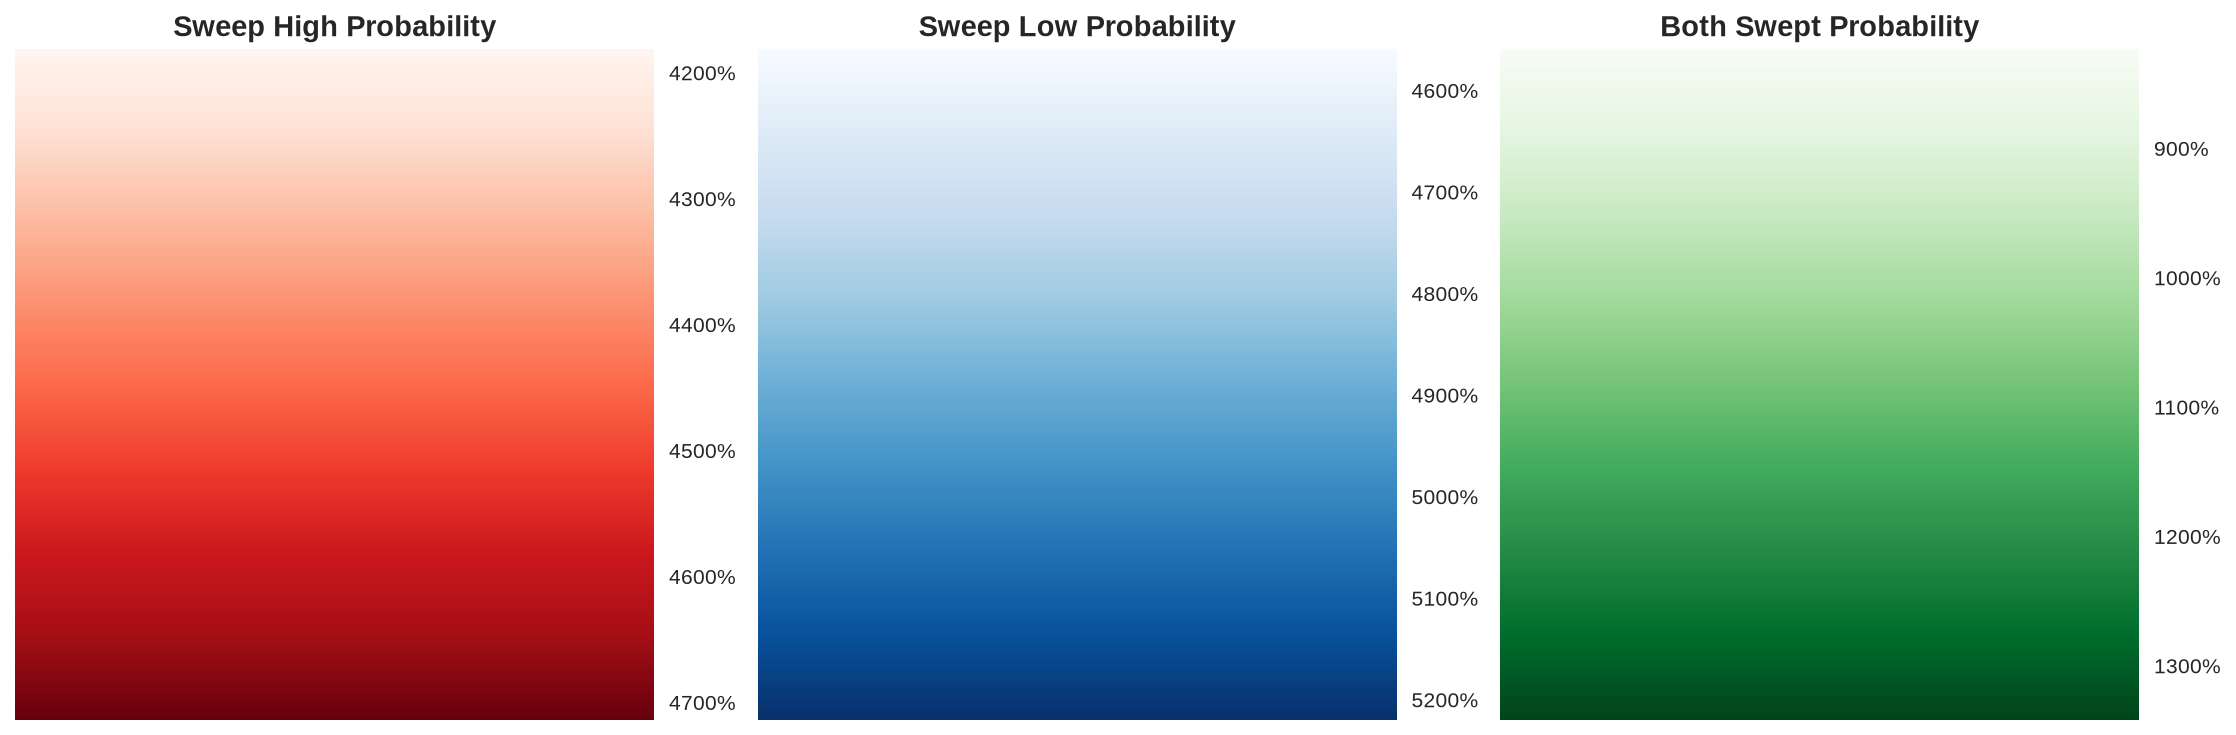
Each session takes out the previous session's high or low roughly 42-52% of the time; both sides together only 8-13%. Levels are zones to trade through, not walls.
Expect retests of the prior session's high/low - but not necessarily a full double sweep.
3 · Session ranges are near parity, not 2x
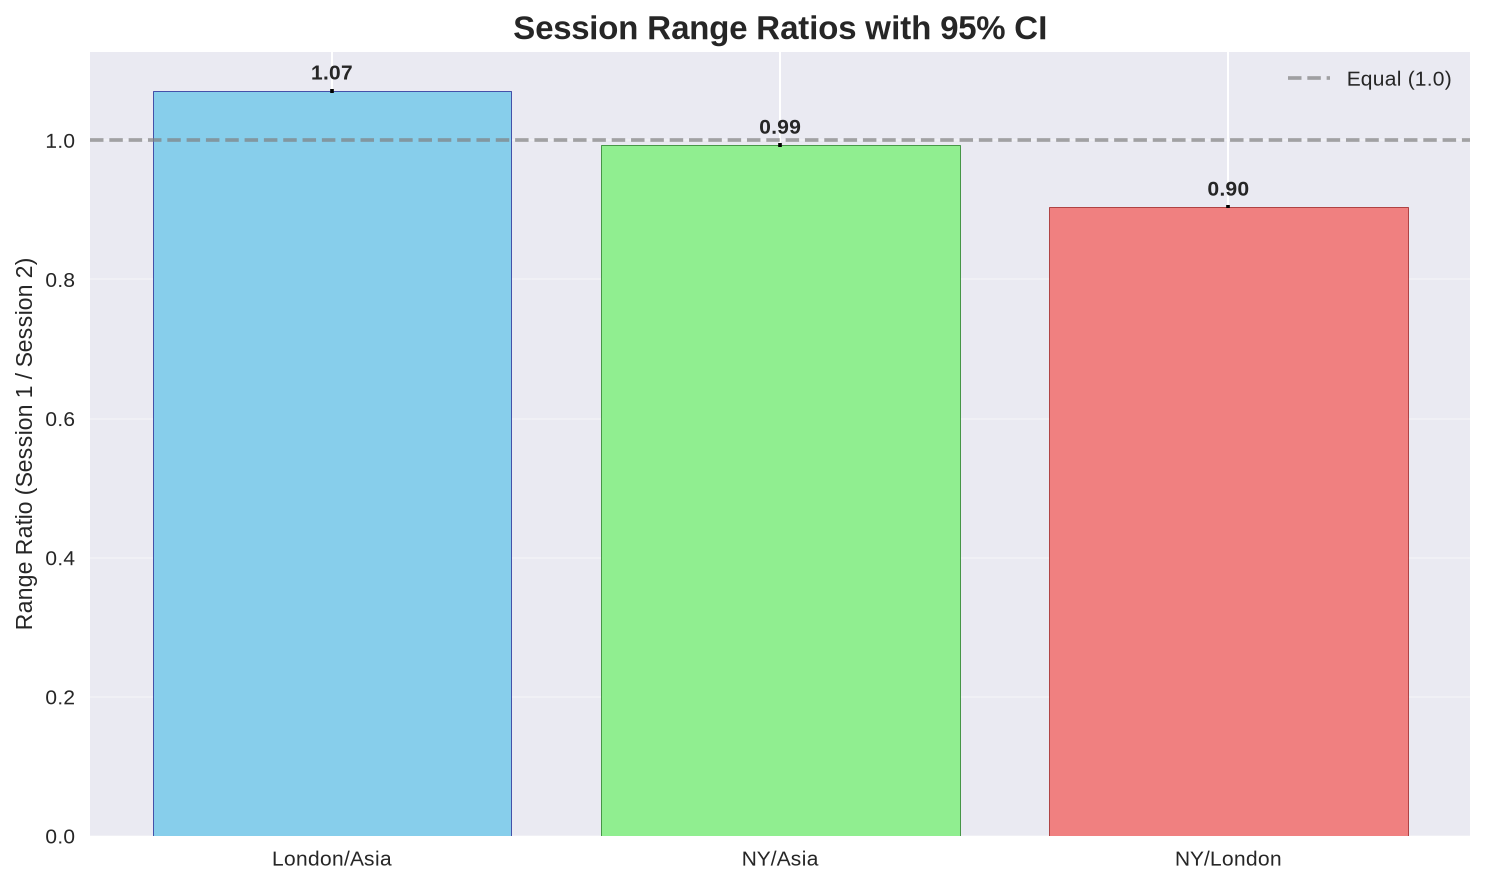
London is only ~7% wider than Asia (1.07x), NY ≈ Asia (0.99x), NY ≈ 0.90x London. The "London is twice Asia" belief comes from overlapping definitions.
Size each session with its own history, not folklore ratios.
4 · Volatility persists session to session
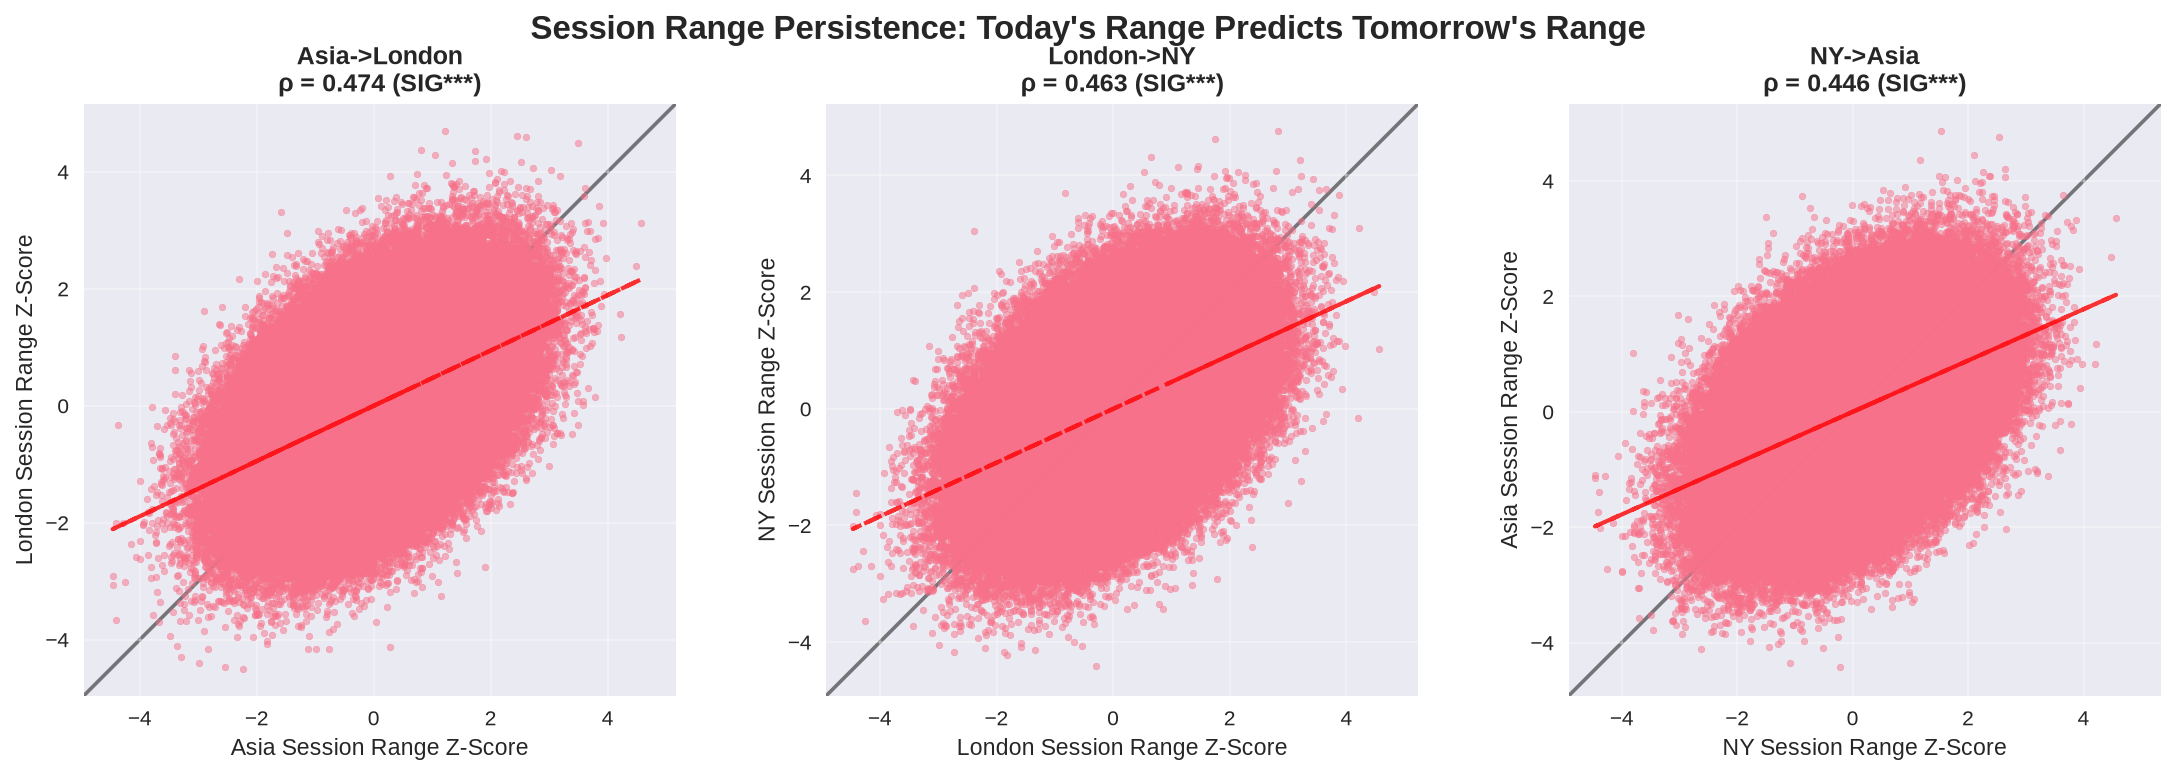
Today's session range predicts tomorrow's: ρ ≈ 0.45-0.47 across all handoffs, and your range-ratio idea (Asia vs its own 30-session mean → London) hits ρ ≈ 0.35.
A big session hands off to a big session - plan risk accordingly.
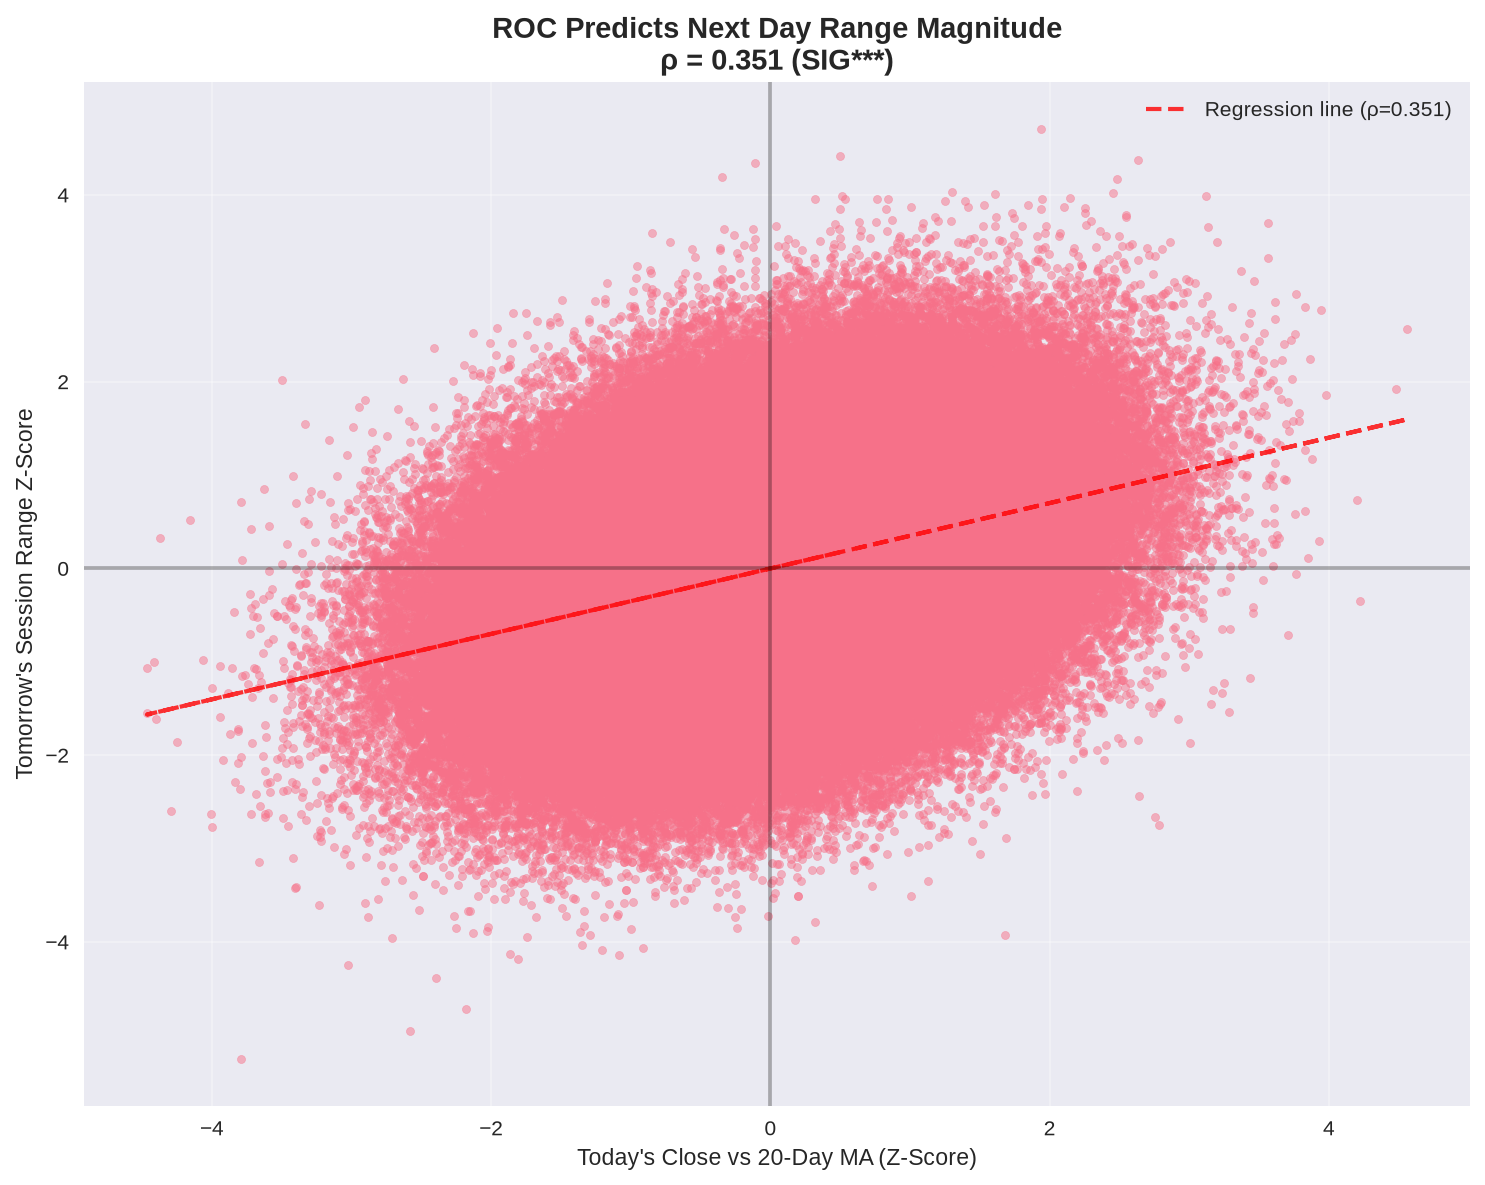
5 · ROC predicts size, not direction
Opening-gap z and 20-day MA z predict session/day range (ρ ≈ 0.21-0.35) but direction is a coin flip (~49%). Magnitude yes, sign no.
Use momentum for expected range sizing; get direction elsewhere.
6 · Monday defines the week
Monday prints 31.4% of weekly highs and 23.1% of weekly lows; Mon-Wed accounts for 55% of weekly highs. Early-week action dominates.
The weekly framework is usually set by Wednesday.
7 · Asia→London: proximity is the edge
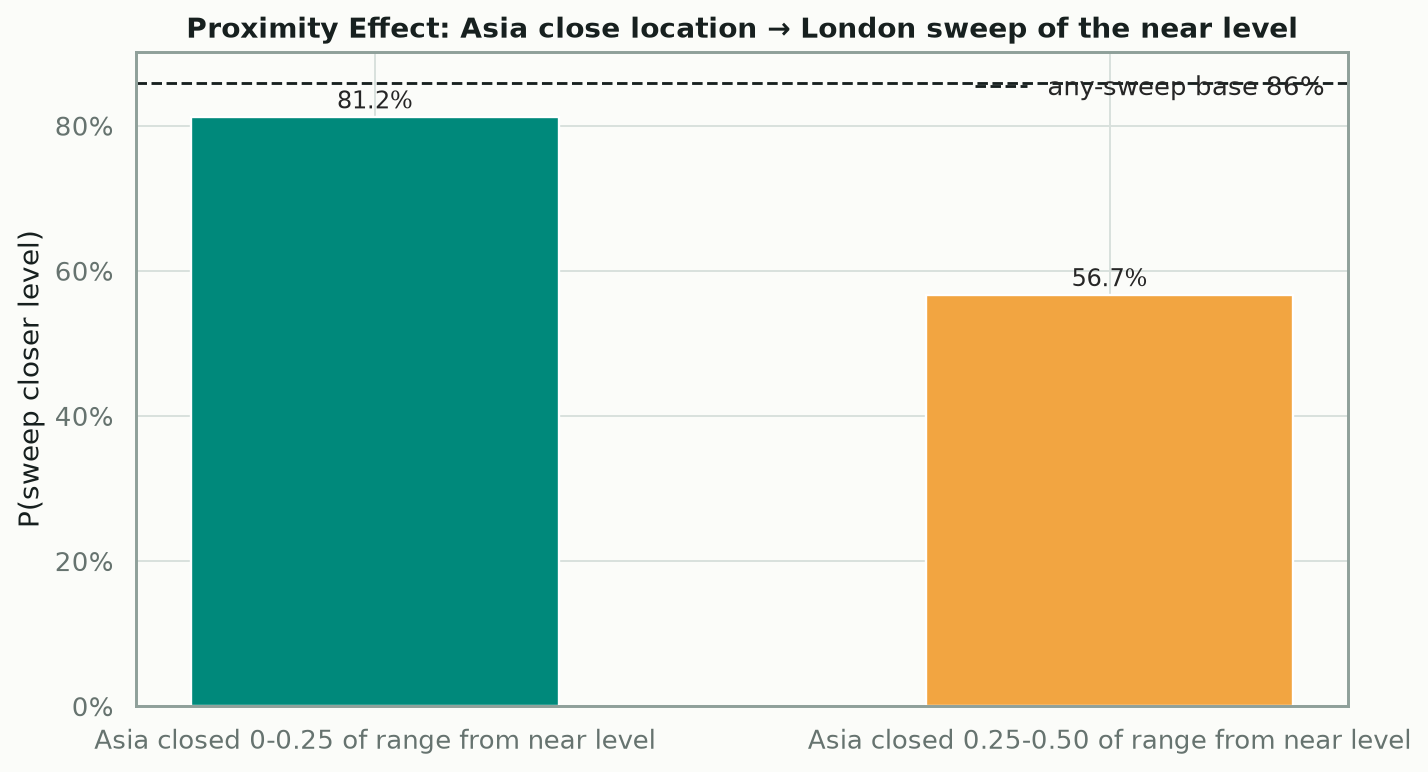
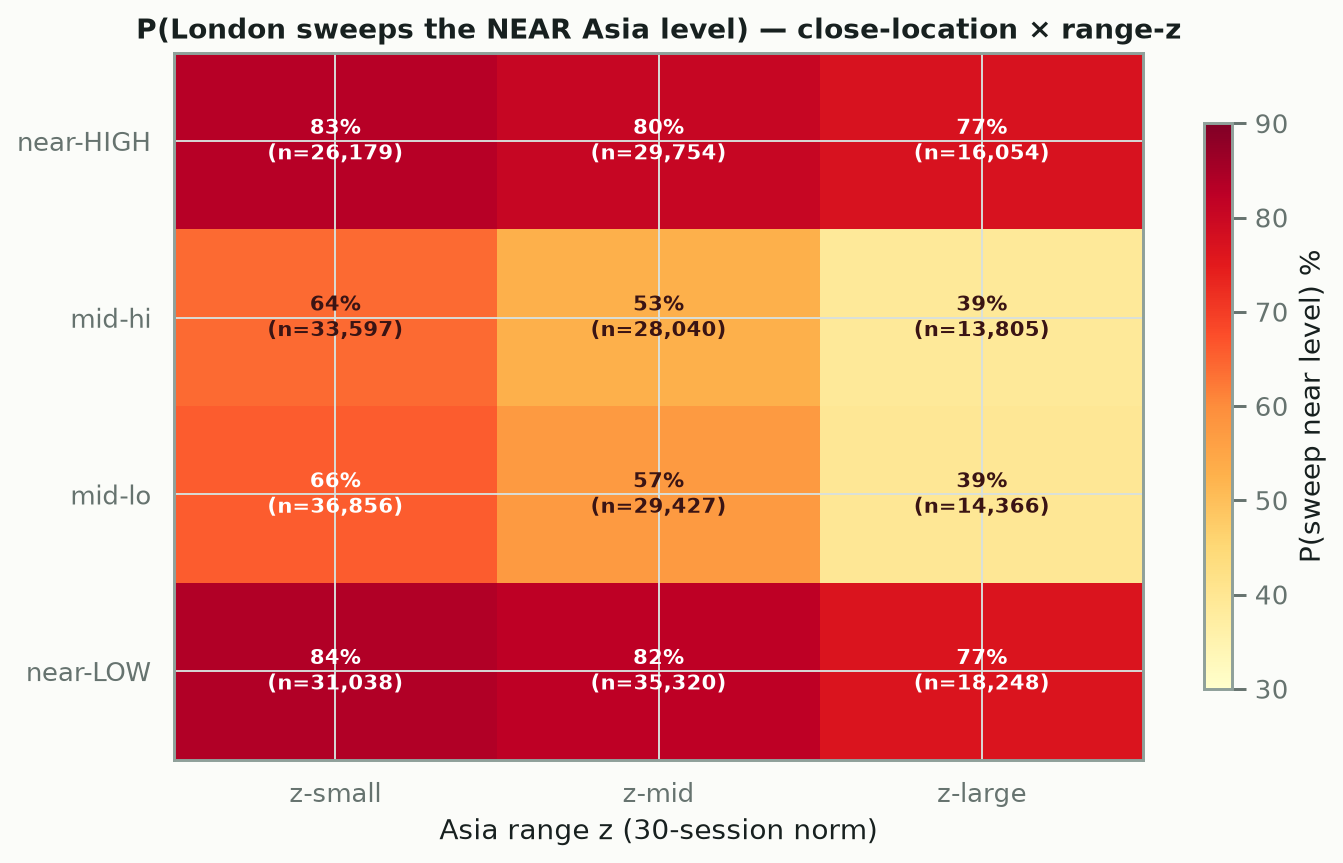
London opens at Asia's close, so where Asia closes inside its own range decides what London raids. An outer-quartile close makes the near Asia extreme an ~81% sweep target (77-87% across range-z); mid-range closes drop it to 39-66%. Direction of London's close stays a coin flip.
Anchor London levels off Asia's close location and range-z — the sweep is a wick, so fade it, don't chase it.
H1
H1: Daily Extreme Maker
Compares high and low attribution against a uniform 33.3% baseline.
In plain English
The Asia session (00-08 UTC) creates the day's high 43.4% of the time and the low 37.8% - well above the 33.3% expected if all three sessions were equal. Strikingly, when a session does set the day's extreme, it almost always happens in the very first hour of that session's open: the three tall bars sit exactly at hours 0, 8 and 16 UTC.
Takeaway: Watch the first hour of each session - that's when the day's high or low is most likely to be printed.
H2
H2: Adjacent Session Sweeps
Shows high, low, and double-sweep rates for each adjacent session handoff.
In plain English
A "sweep" means the next session breaks through the previous session's high or low. Asia→London sweeps London's high 47.1% of the time and low 52.2%; London→NY 41.8%/46.7%; NY→Asia 46.4%/45.6%. Both extremes being swept in one session is rarer (8-13%). Day-to-day, about 44% of highs and 48% of lows get taken out.
Takeaway: Previous session highs and lows are real battlegrounds - they get tested and broken roughly half the time, so treat them as zones, not walls.
H3
H3: Relative Session Ranges
Uses medians plus interquartile bands to avoid implying unavailable raw distributions.
In plain English
With equal 8-hour blocks, London's typical range is only ~7% larger than Asia's (median ratio 1.07), NY is nearly identical to Asia (0.99), and NY is ~10% smaller than London (0.90). The popular idea that London is 2x Asia comes from overlapping FX-style definitions - with clean non-overlapping sessions the sizes are remarkably similar.
Takeaway: Don't assume London dwarfs Asia: on equal footing, session ranges are close to parity - differences are modest, not multiples.
H4
H4: Range Persistence
Ranks adjacent-pair Spearman correlations for prior versus next session range z-scores.
In plain English
Volatility strongly persists from one session to the next: Asia's range predicts London's with ρ=0.47, London→NY 0.46, NY→next Asia 0.45 (all highly significant). Your original idea also holds - today's Asia range vs its own 30-session average predicts tomorrow's London range with ρ≈0.35. A big session tends to be followed by another big session.
Takeaway: Size your risk for the next session off the current session's range: unusually large sessions usually hand off to unusually large ones.
H5
H5: Magnitude Predictors
Summarizes the predictive-magnitude correlations present in the results file.
In plain English
Rate-of-change signals predict how far price will move, not which way. A session's opening gap (z-scored) correlates ρ≈0.21 with its own range; today's close vs the 20-day MA correlates ρ≈0.35 with tomorrow's range. Direction prediction sits at ~49% - a coin flip. ROC tells you the size of the expected move, nothing about its sign.
Takeaway: Use ROC/momentum signals to size expected range for the session or day ahead - then rely on other tools for direction, because ROC has none.
H6
H6: Weekday Extremes
Shows whether weekly highs and lows concentrate early or late in the UTC week.
In plain English
Monday prints the week's high 31.4% of the time (vs 14.3% expected) and the week's low 23.1%. The first three days (Mon-Wed) account for 55.1% of weekly highs and 48.8% of weekly lows. The weekend still matters - Sat/Sun combined set 25.9% of highs and 26.6% of lows - but early week action dominates.
Takeaway: The week's directional framework is usually decided by Wednesday - Monday's move in particular often defines the week.
H8
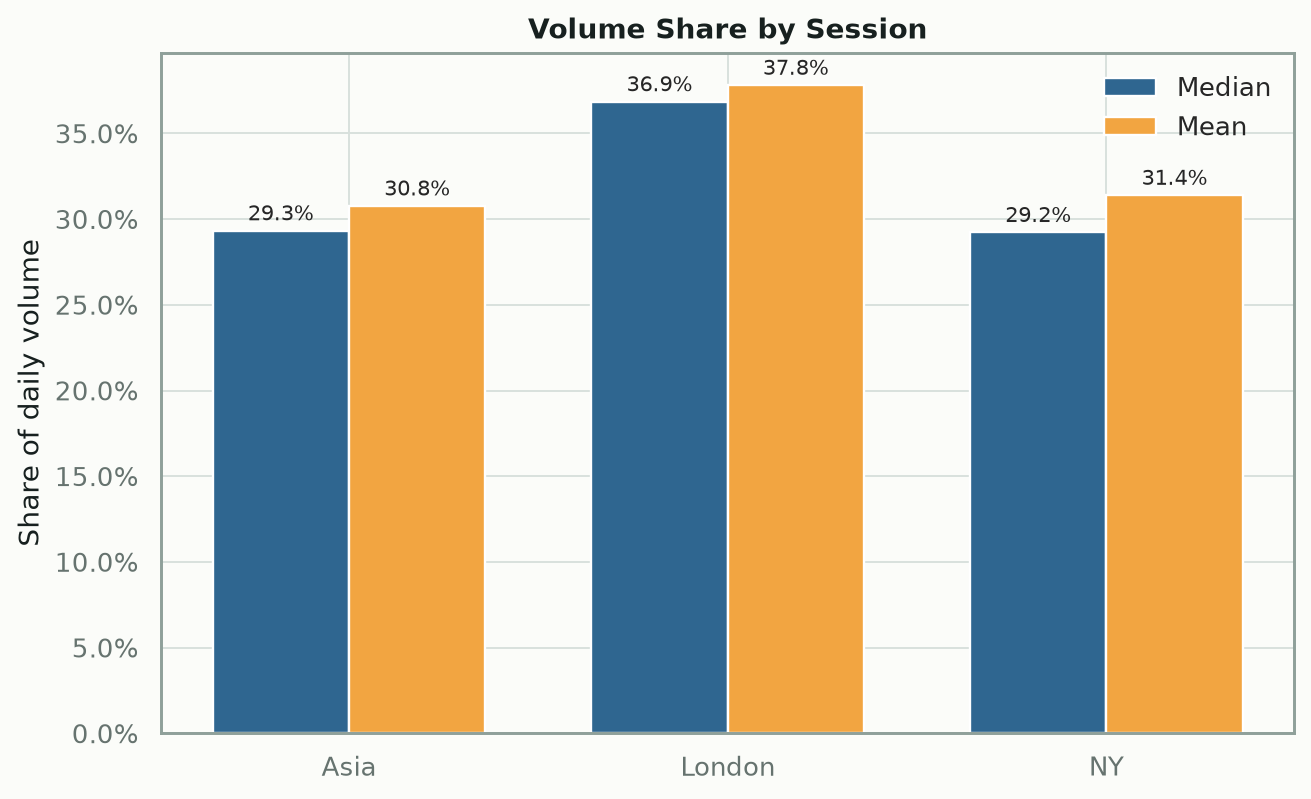
H8: Volume Share
Compares median and mean daily-volume share across the three sessions.
In plain English
London is the volume leader: median 36.9% of each day's notional trades during its 8 hours (mean 37.8%), versus Asia 29.3% and NY 29.2%. Volume also predicts range: session volume z-score vs next session range z ρ≈0.43 (SIG***) - high-volume sessions beget wide next sessions, mirroring the H4 persistence finding.
Takeaway: London carries the most flow - when volume spikes in any session, expect an outsized range in the next one.
H9
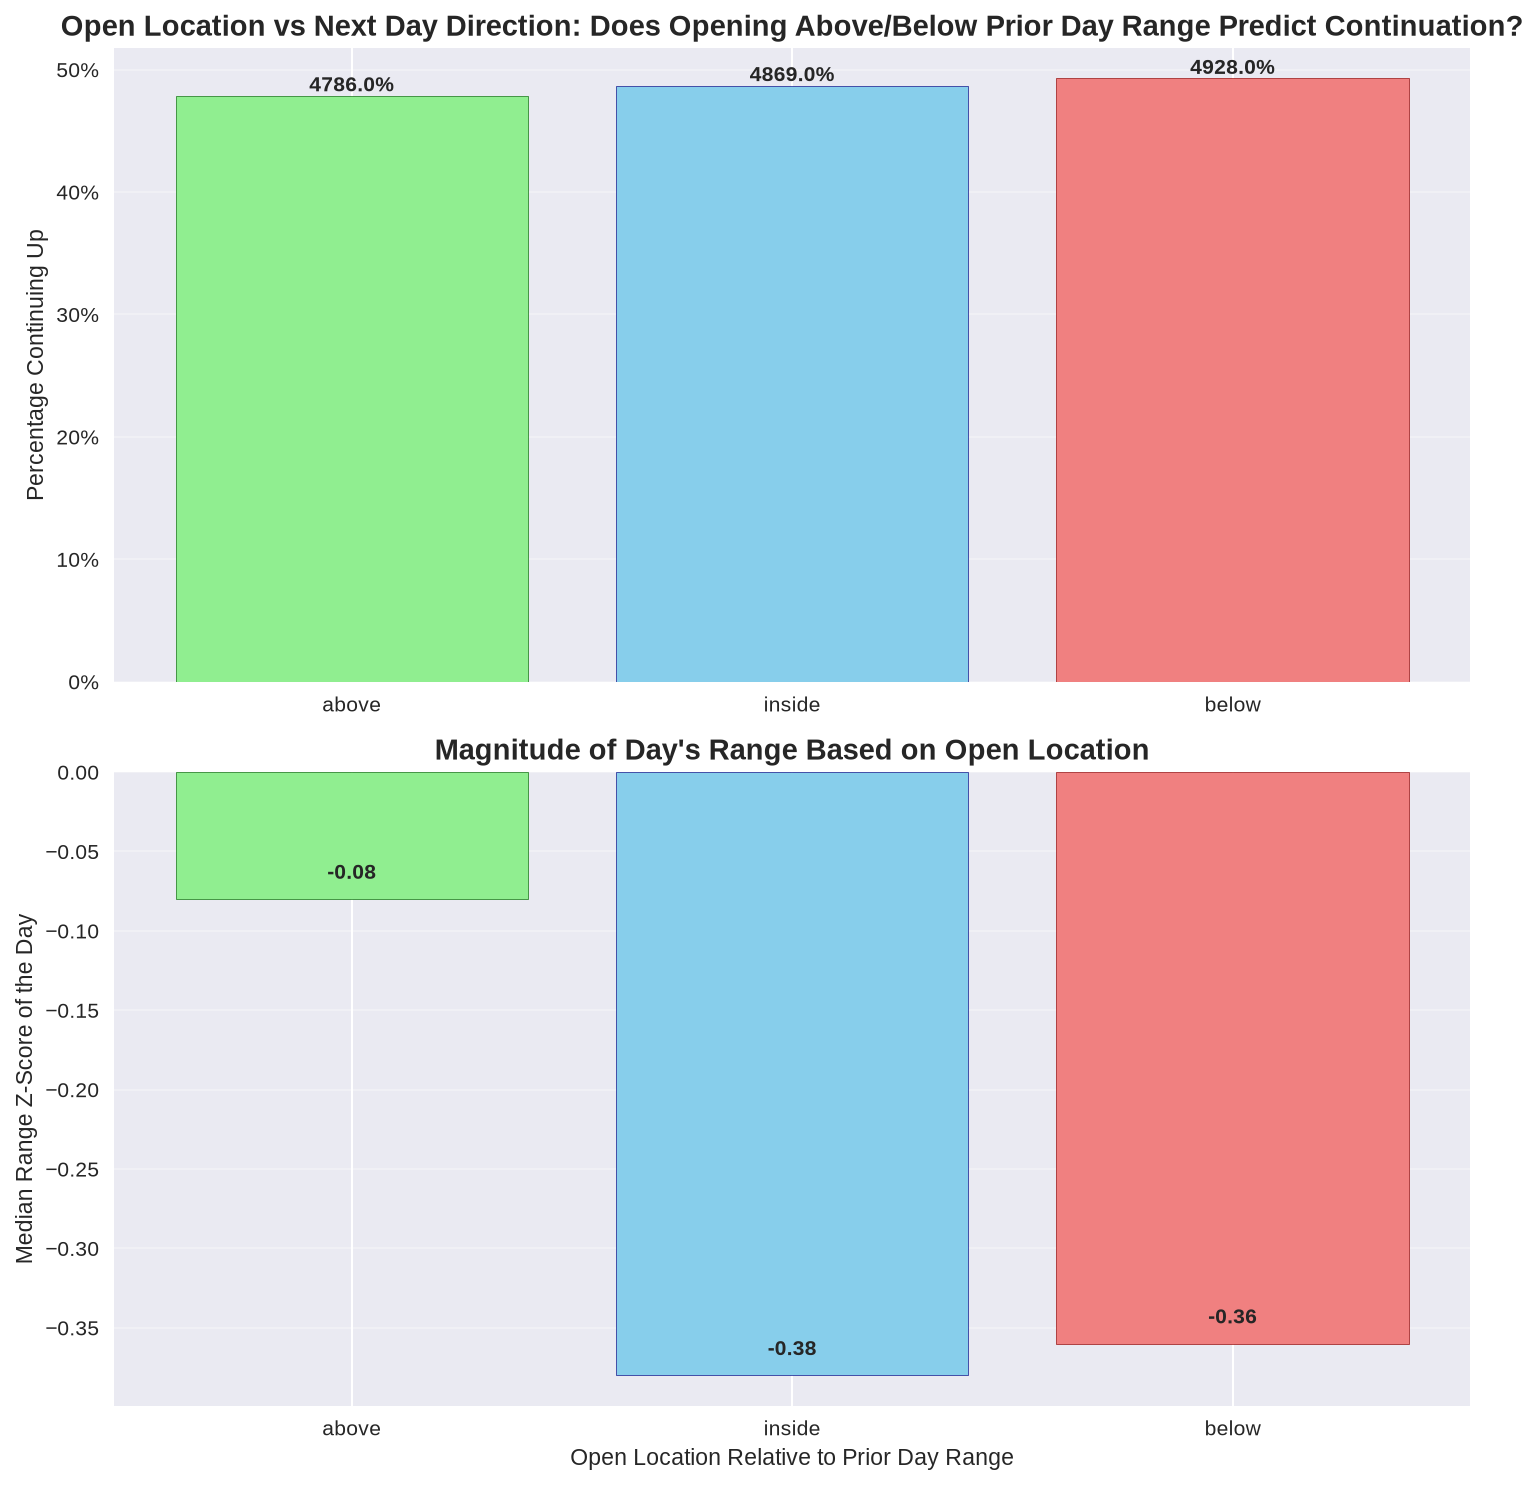
H9: Open Location
Pairs open-location direction rates with the median range-z response.
In plain English
Opening above the prior day's high, inside it, or below the prior low gives almost no directional edge: continuation rates are 47.9% / 48.7% / 49.3% - effectively coin flips. But open location does matter for range: opens outside the prior day's range (above high / below low) produce larger-than-normal days (median range z near 0 vs -0.38 inside), consistent with gap-extension behavior.
Takeaway: Don't chase gaps for direction - but a gap open signals a wider-than-normal day, so adjust expectations (and stops) accordingly.
AL1
AL1: Asia→London Proximity
London opens at Asia's close, so open proximity = where Asia closed in its range.
In plain English
London sweeps at least one Asia extreme on 85.9% of days, and when it sweeps it hits the closer level 80.3% of the time. When Asia closed in the outer quartile of its own range (rel < 0.25), the near extreme gets swept 81.2% of the time; a mid-range close drops it to 56.7%.
Takeaway: Asia's close location is the single most important input at London's open - outer-quartile closes make the near extreme a high-probability raid target.
AL2
AL2: Joint Model — location × range-z
Sweep probability of the near Asia level conditioned on close location and Asia range z.
In plain English
Proximity dominates: outer-quartile closes give 77-84% sweep odds regardless of range-z. Range-z only bites on mid-range closes - a small Asia range leaves both levels close (64-66% sweeps), a large Asia range makes them far walls (~39%). Direction of Asia's close adds only a couple of points when it agrees with the near side.
Takeaway: Use close-location to pick the raid target and range-z to size how far London will travel - expected London range ≈ Asia range × (1.3 / 1.0 / 0.7 for z-small/mid/large).
AL3
AL3: Range Map — Asia level as target
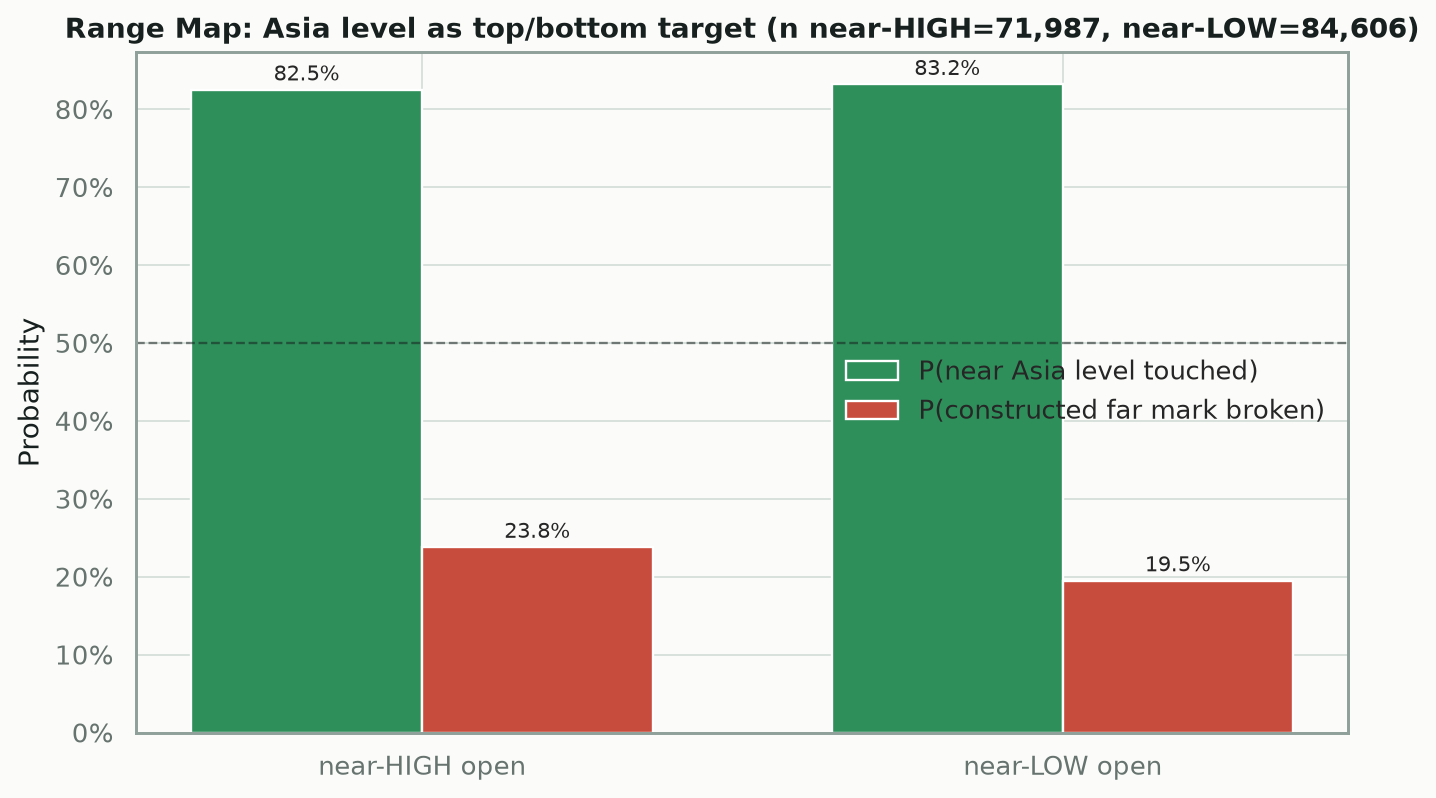
Validates the 'top = Asia high, bottom = Asia high − Asia range' construction.
In plain English
Opening near Asia's high, London touches it 82.5% of the time (median overshoot 0.2-0.4× Asia range), and the constructed floor (Asia high − Asia range) is broken only 23.8% - a workable level map, not a containment band. Direction of London's close remains a coin flip (up-after-up 45.4%).
Takeaway: Trade the sweep as a wick, not a push: place orders at the Asia extreme, expect the tag ~80%, and fade the revert.
Reading Notes
Charts use aggregate statistics from the committed result JSON. No synthetic observations are drawn. Session definitions are computed in the analysis pipeline; the dashboard presents the current result file without re-estimating the underlying study.