📊 Detailed Visualizations
H1: When Do Sessions Create Daily Extremes?
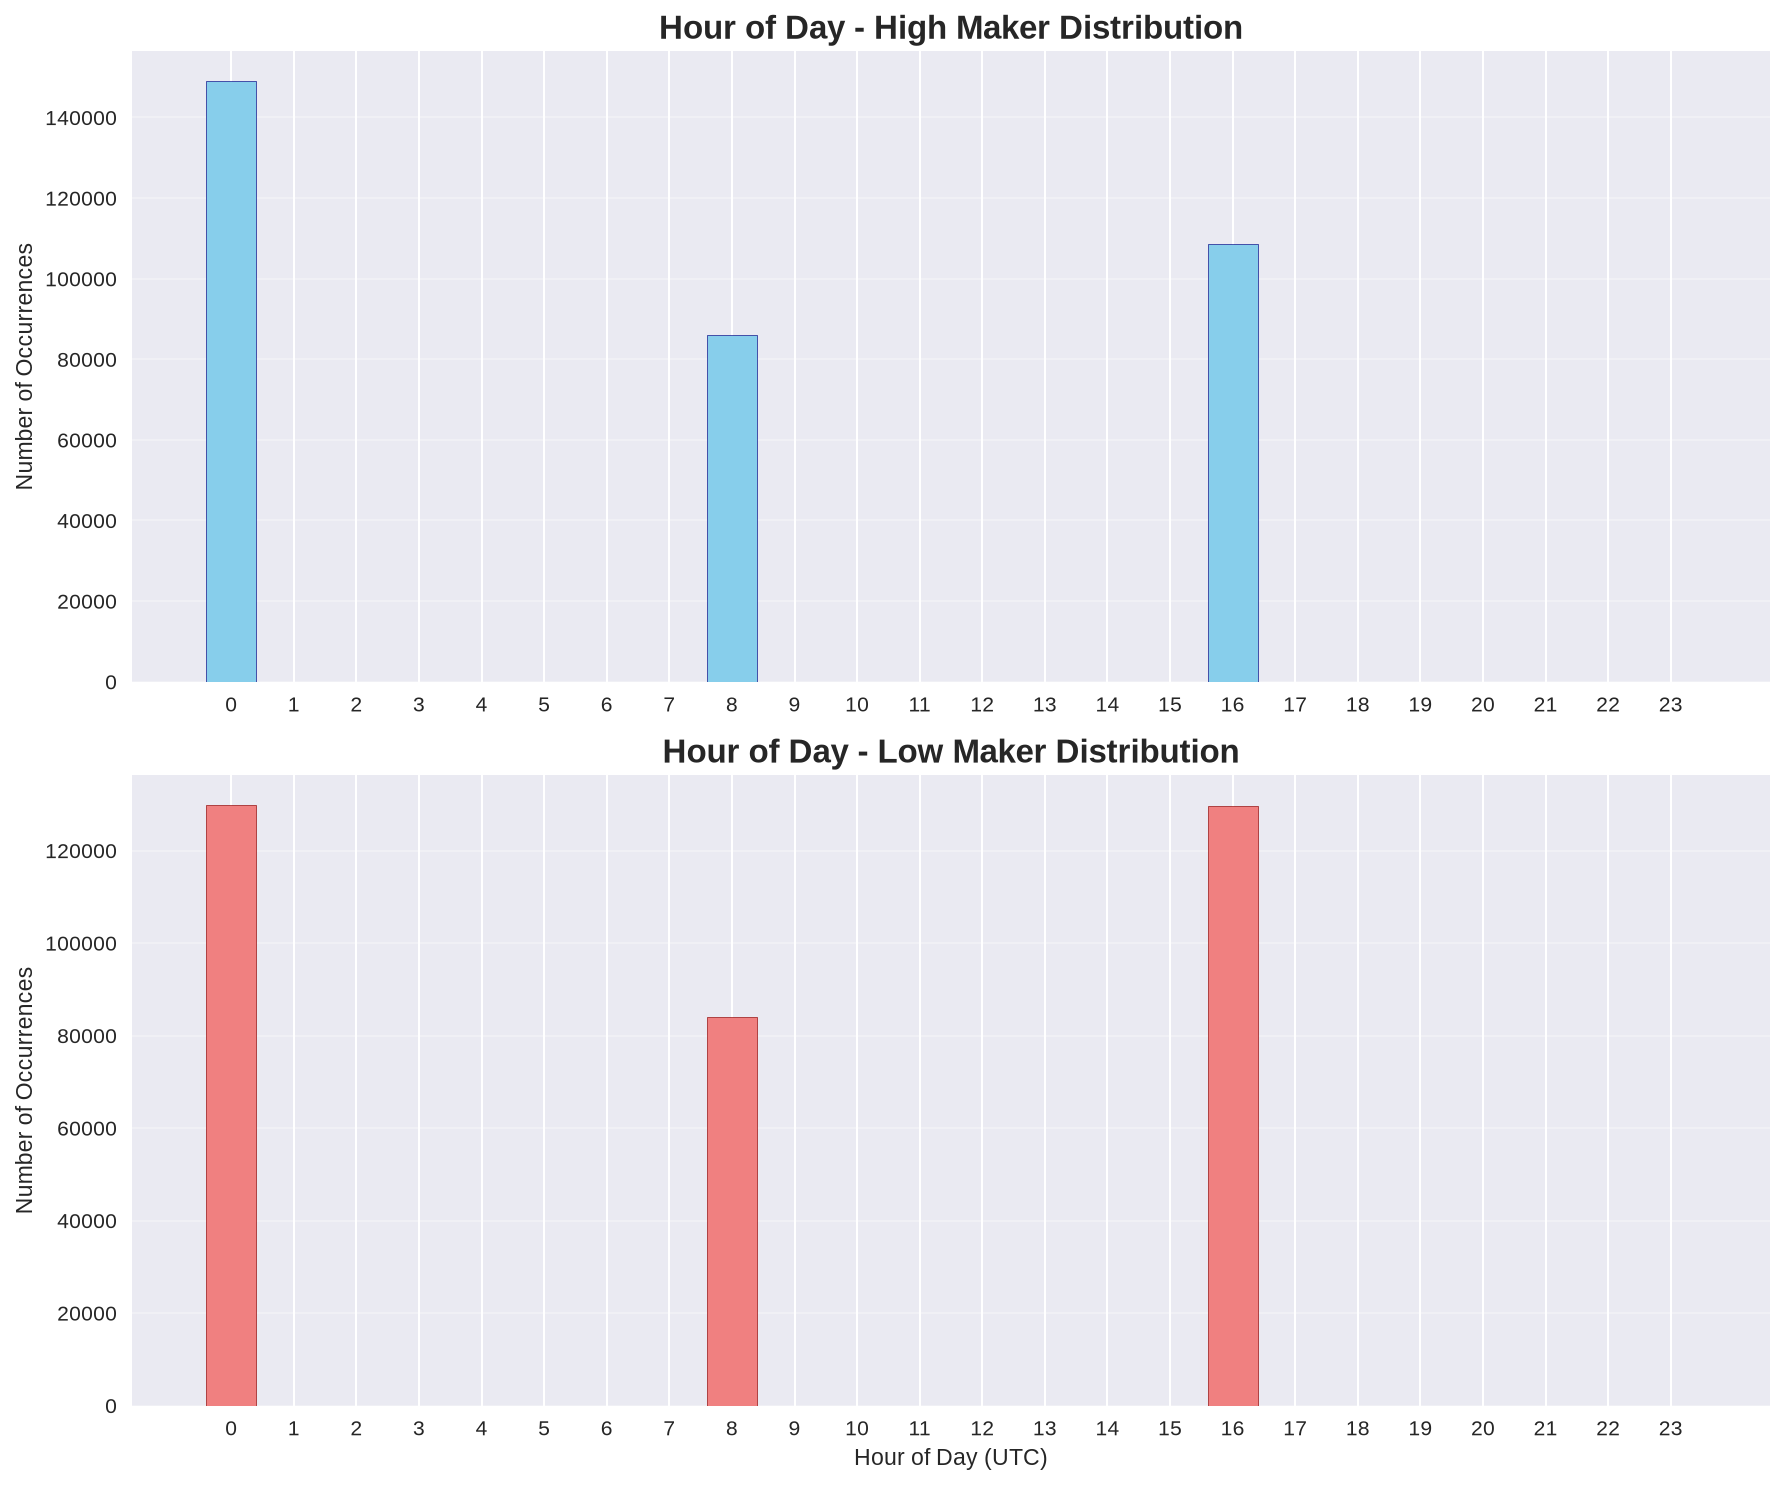
Asia (00-08 UTC) creates the daily high 43.4% of the time and low 37.8%, significantly above the 33.3% expected if sessions were equal.
H2: How Often Do Sessions Sweep Each Other's Extremes?
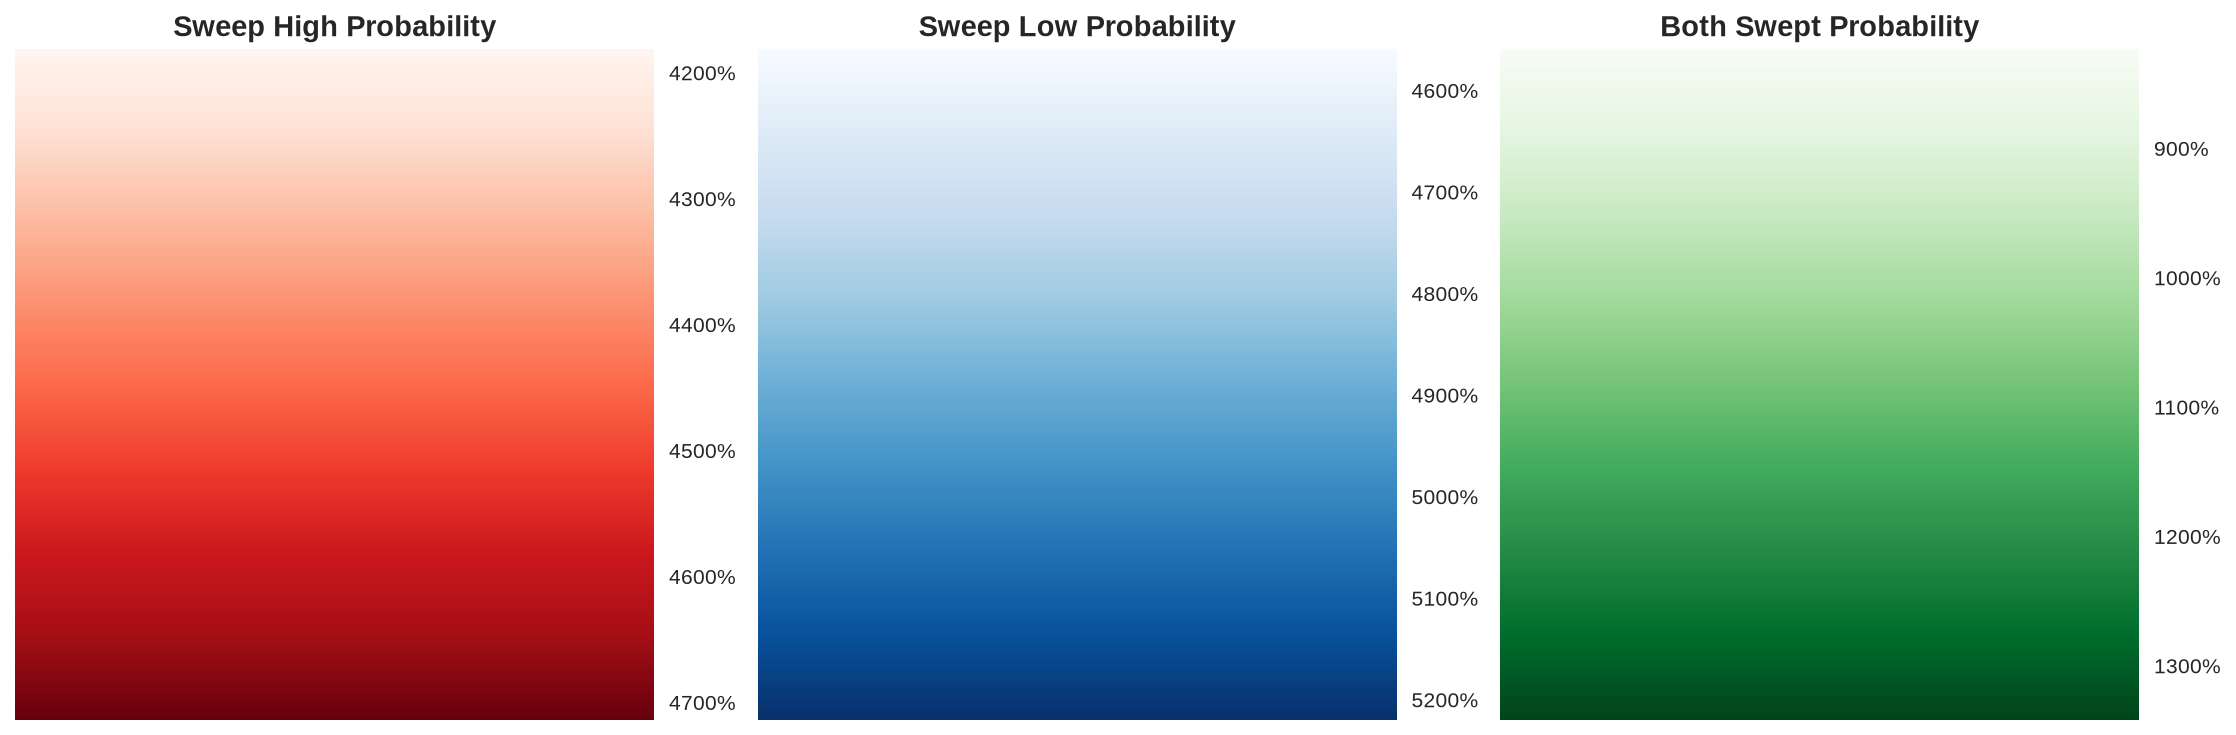
Asia→London sweeps the high 47.1% and low 52.2% of the time. Day-to-day sweeps occur 43.5% for highs and 48.1% for lows.
H3: How Large Are Each Session's Ranges Compared to Others?
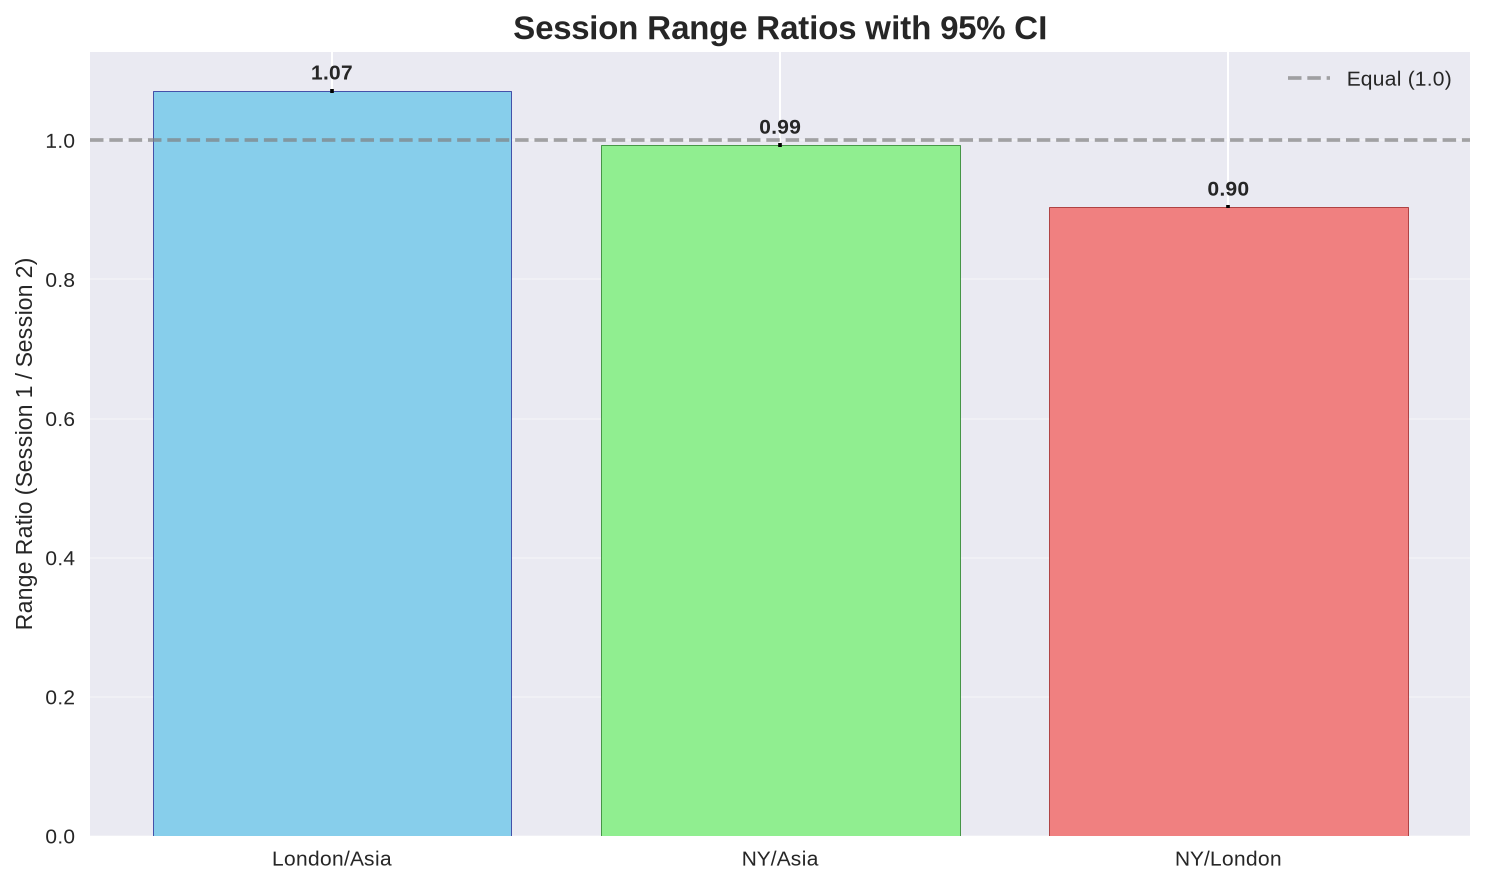
London/Asia median range ratio is 1.07 (not 2× as originally hypothesized). Sessions are approximately equal in size under the non-overlapping definition.
H4: Does Today's Range Predict Tomorrow's Range?
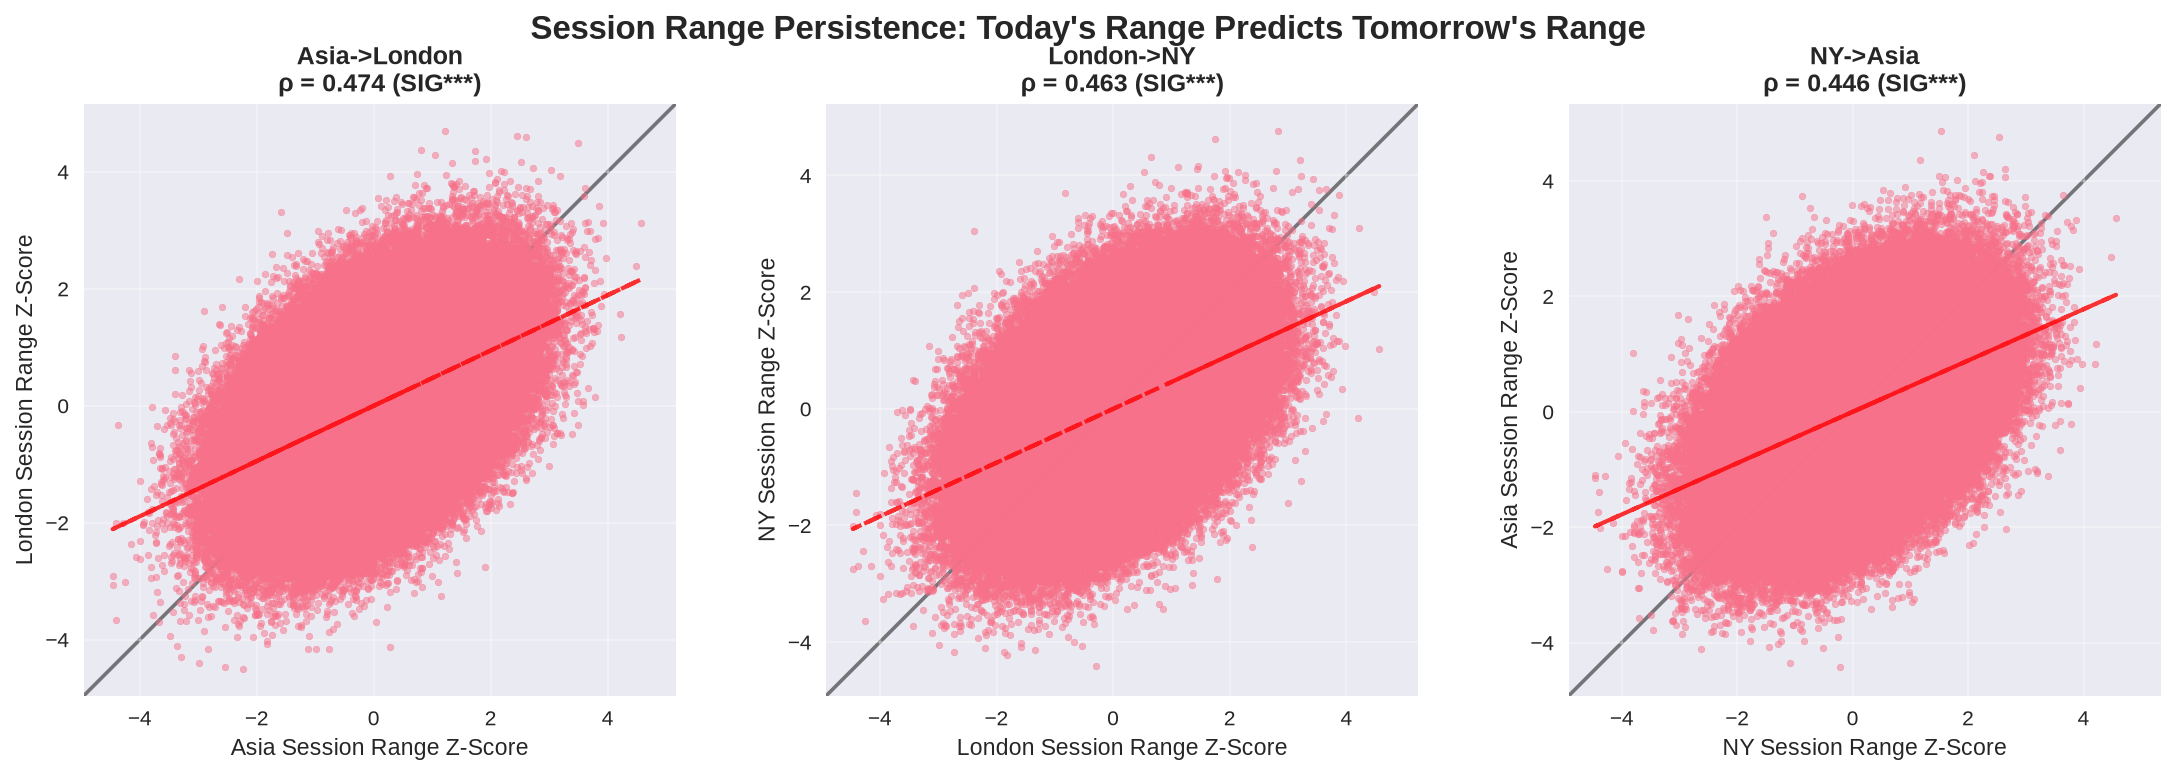
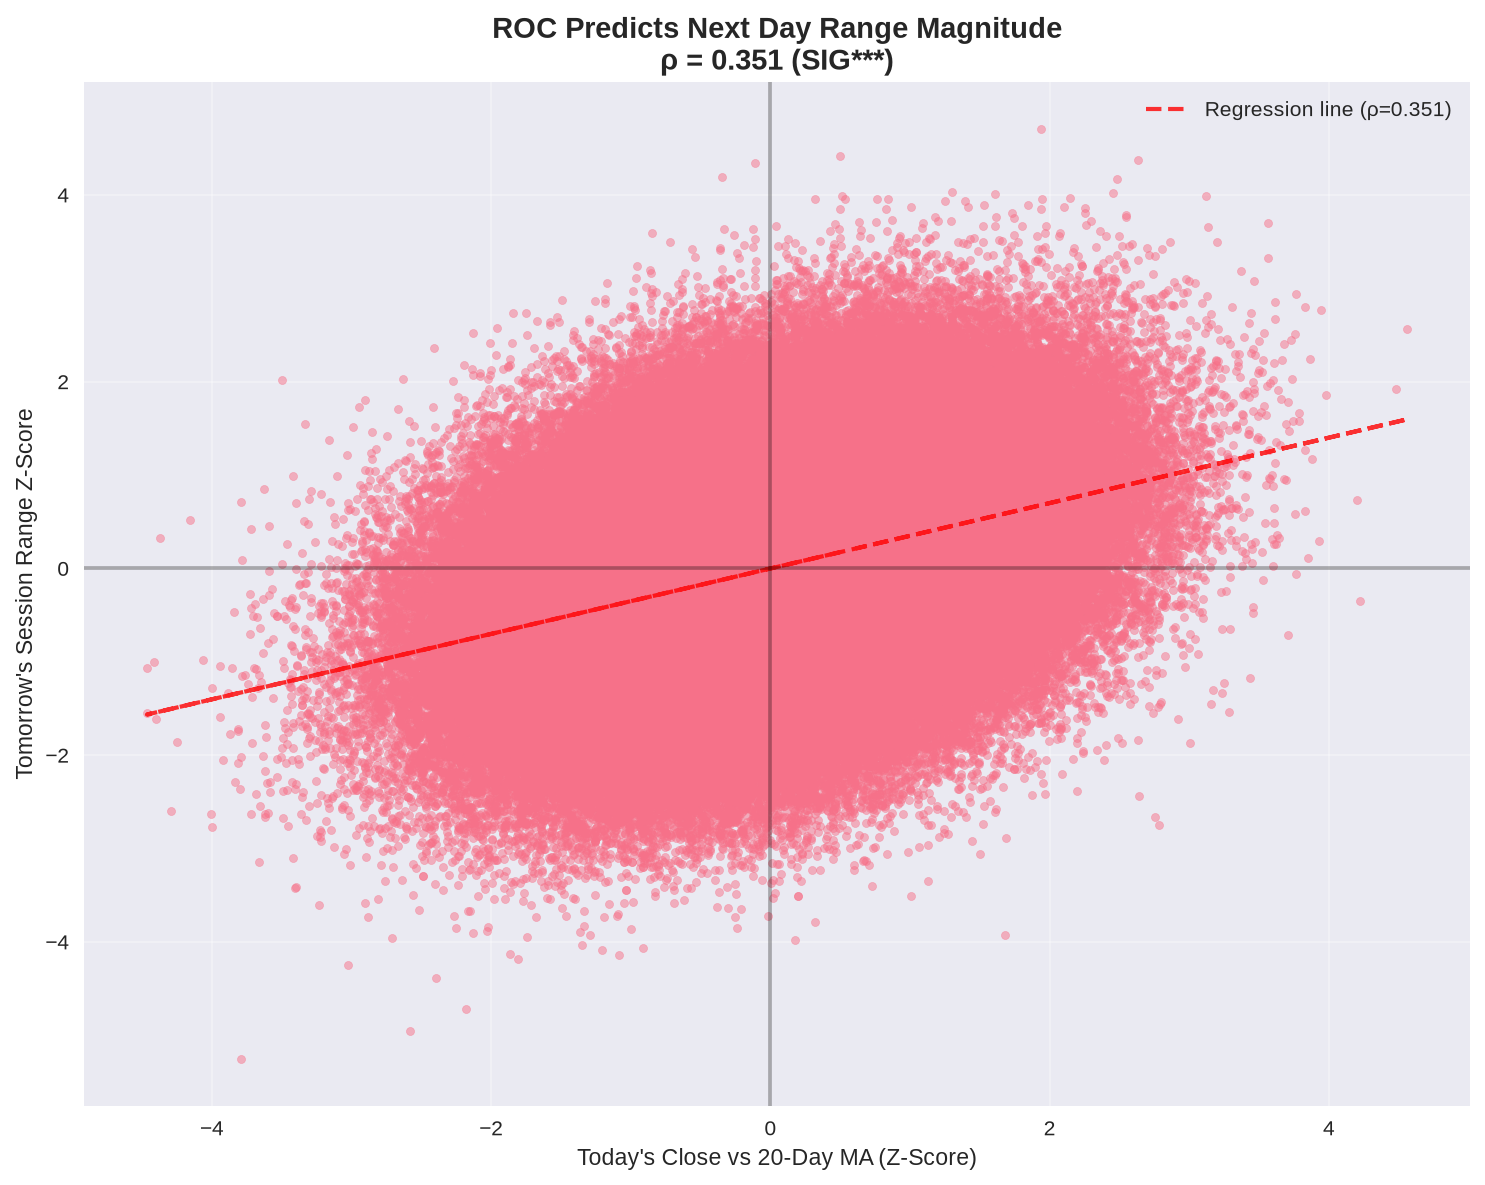
H5: Does Rate of Change Predict Future Movement?
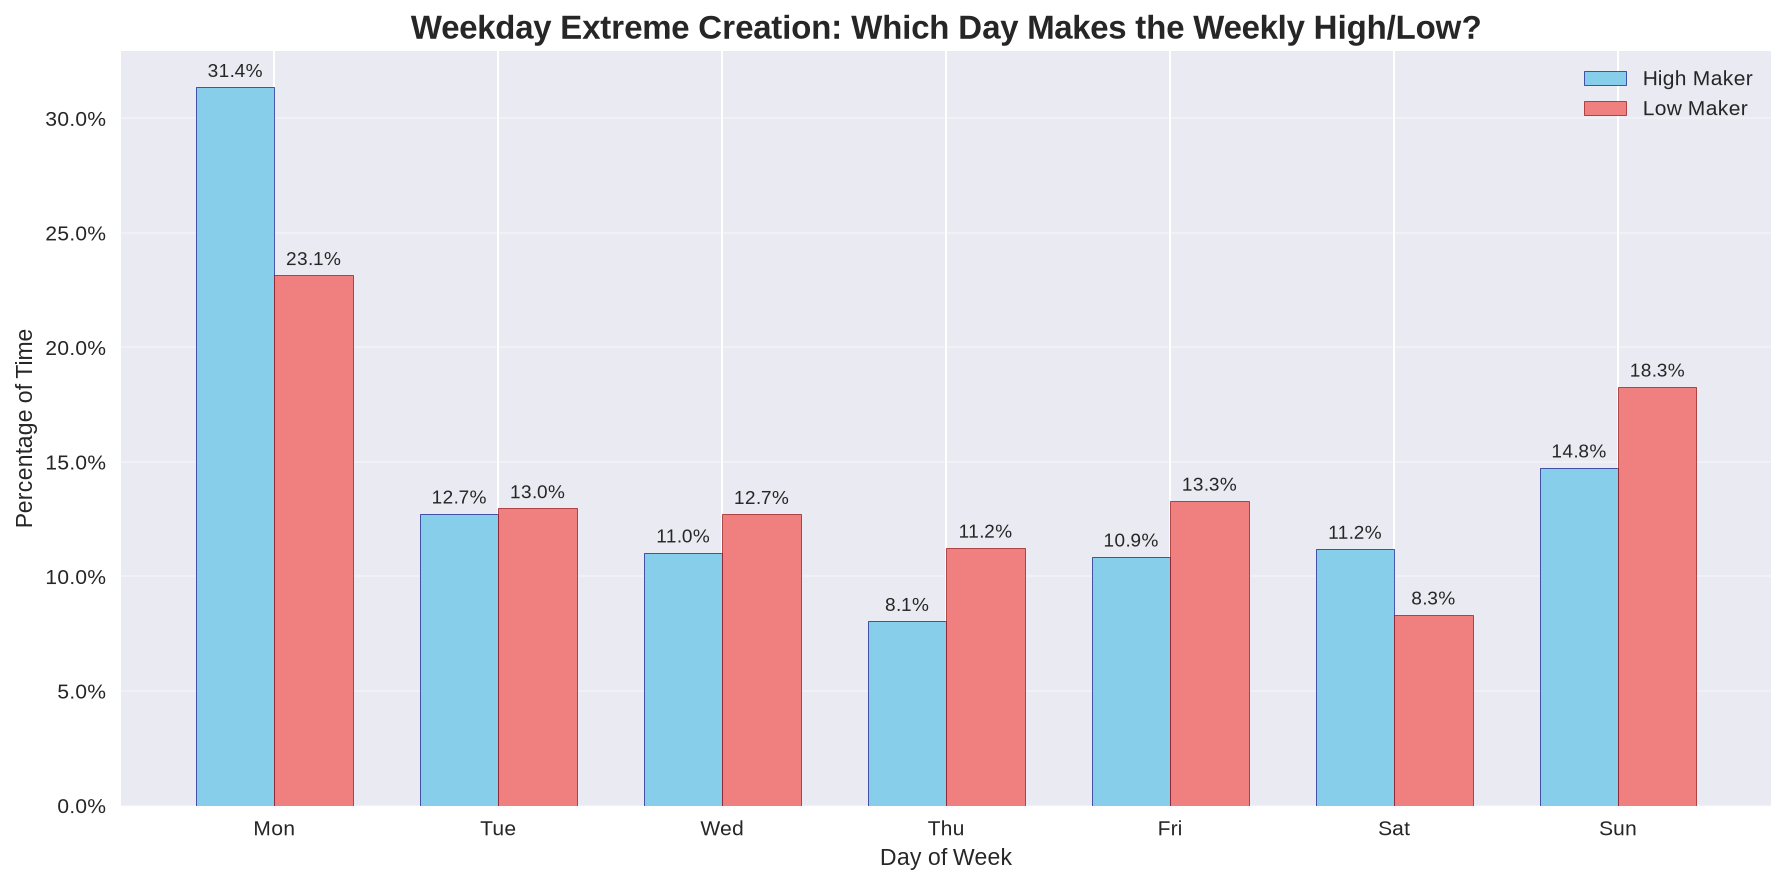
H6: Which Day of the Week Sets Weekly Extremes?
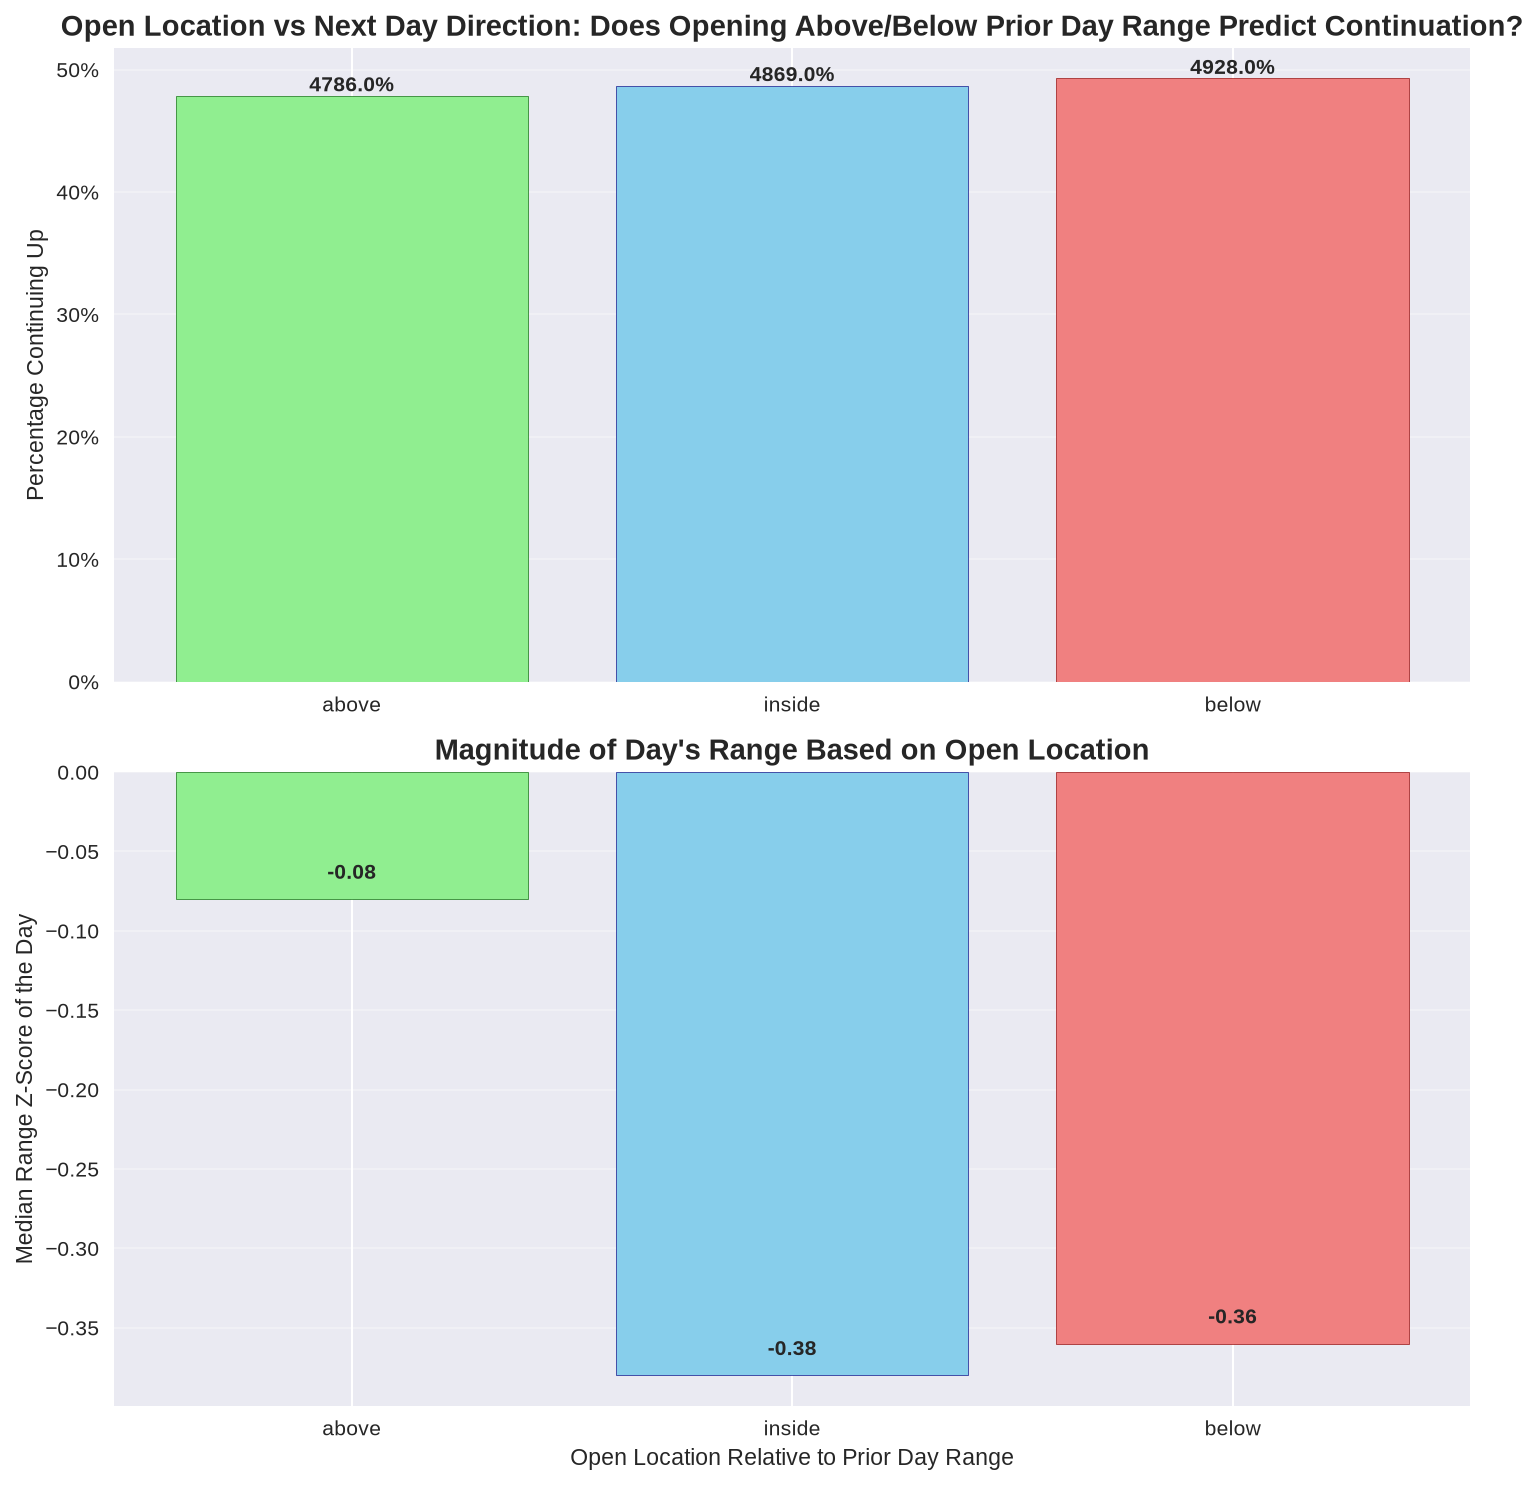
H9: Does Opening Above/Below Prior Day Range Predict Continuation?
⚠️ Important Caveats
Session Definition Matters: The attribution of which session creates extremes and relative session sizes depends critically on how you define the session boundaries:
- Non-overlapping (Primary): Asia 00-08, London 08-16, NY 16-24 UTC → Asia high 43.4%, London/Asia ratio 1.07
- Overlapping (Conventional): Asia 00-09, London 09-17, NY 13-22 UTC → Asia high 48.2%, London/Asia ratio 0.60
However, the core dynamics (volatility persistence, sweep probabilities, ROC predictability) are similar under both definitions.
📓 Methodology Notes
- Data: 2 years of 15-minute OHLCV data for 814 Bybit USDT perpetual futures (filtered from 863 total symbols based on data availability)
- Session Definitions: Both non-overlapping (equal 8-hour blocks) and overlapping (conventional FX definitions) analyzed
- Statistical Rigor: All results include effect sizes, confidence intervals, breadth measurements, Bonferroni correction for multiple testing, and out-of-sample validation where predictive
- Signal-Only: This analysis is for educational/research purposes only. No auto-trading components are included.